We’re excited to announce the release of Breezy Cloud v1.13, now live across customer accounts and on our public demo site. This update introduces a new multi-month historical dashboard that transforms raw disinfection data into clear, visual trends for easier tracking, comparison, and program oversight.
This release is the direct result of feedback from hospitals and other facilities using Breezy every day — and it’s an important step forward in our longer-term roadmap to make disinfection programs more measurable, auditable, and operationally actionable.
What’s New in v1.13
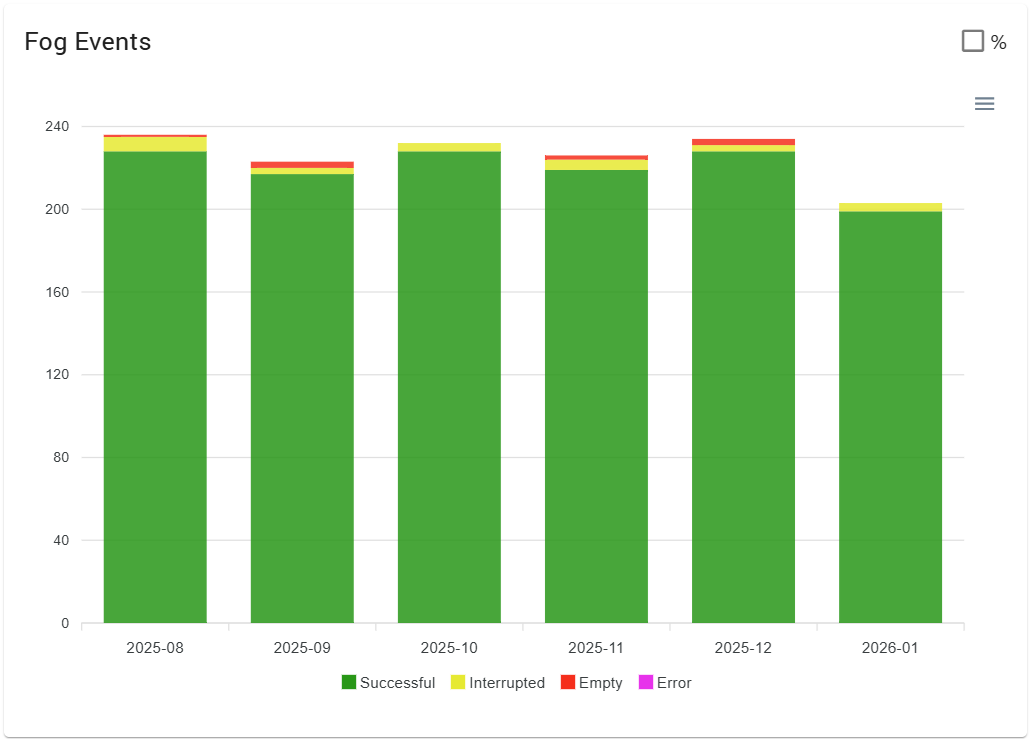
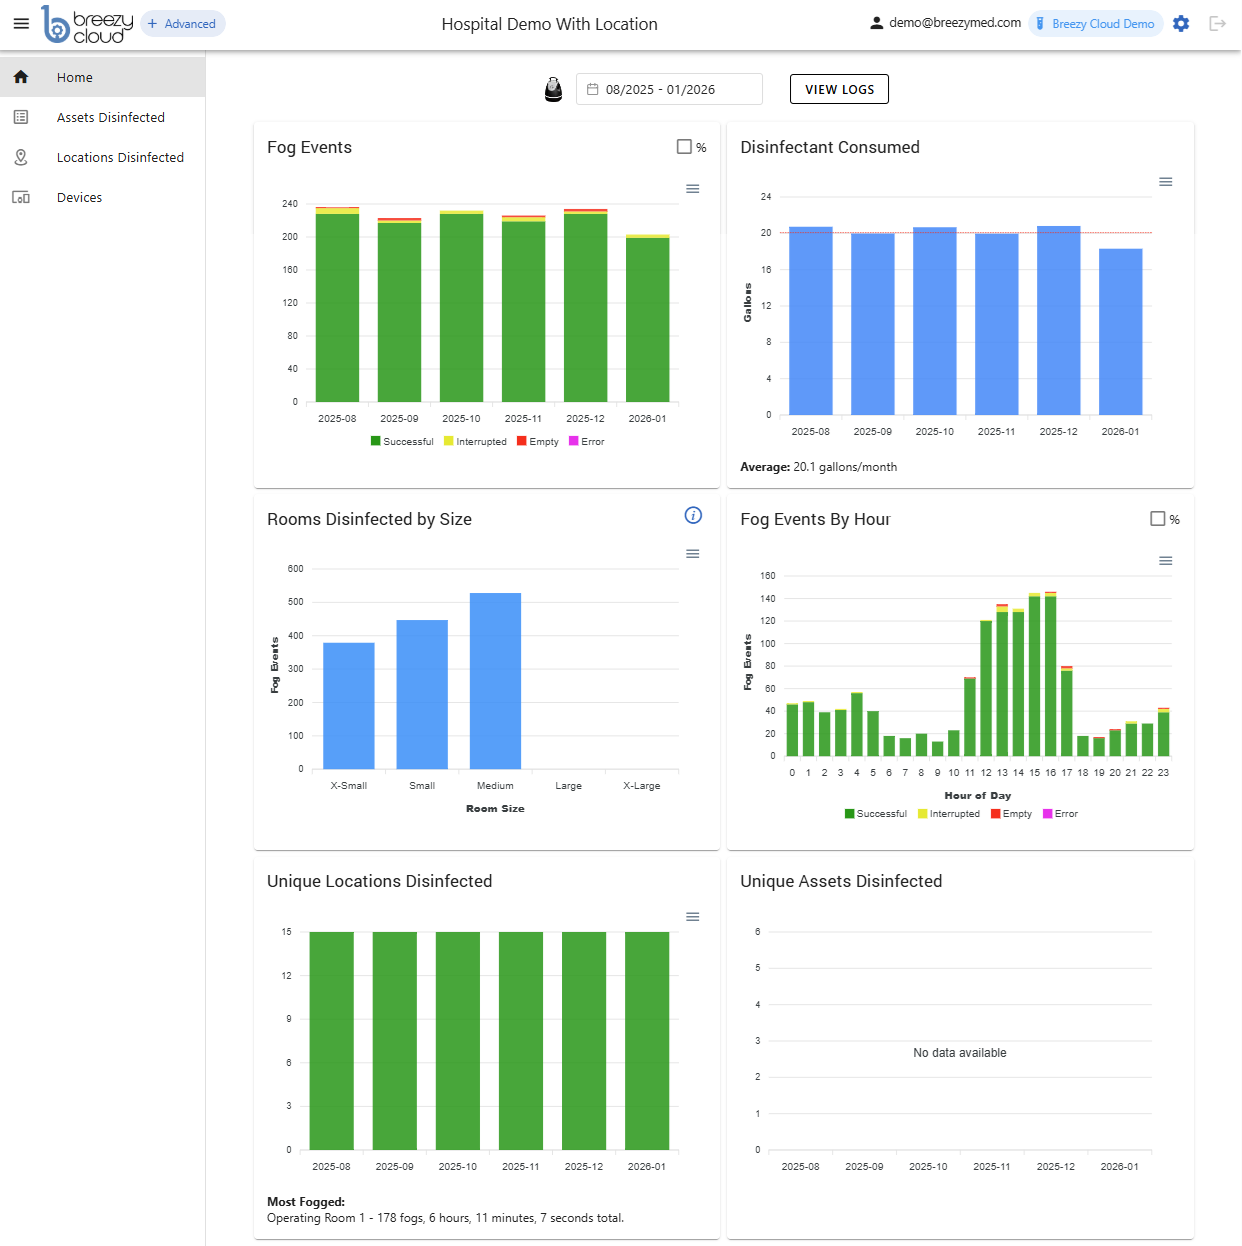
The new main dashboard displays a selectable number of months of historical data in graphical format, allowing users to quickly see patterns, gaps, and changes over time. These views are designed to be immediately understandable to visualize trends or omissions. Visualizations include:
-
Fog Events
-
Disinfectant Consumed
-
Rooms Disinfected by Size
-
Fog Events by Hour
For customers using Breezy Cloud Advanced, the dashboard also includes:
-
Unique Locations Disinfected
-
Unique Assets Disinfected
Why This Matters for Hospital Teams
Over time, infection prevention and EVS leaders told us they needed a clearer way to answer practical questions such as:
-
Are rooms or locations being missed on certain days?
-
Has disinfectant usage changed unexpectedly?
-
Are treatment volumes trending up, down, or shifting by time of day?
-
Are assets and high-risk locations being consistently included?
The v1.13 dashboard makes these trends visible at a glance, helping teams identify omissions, usage shifts, and productivity patterns that may otherwise go unnoticed when reviewing individual fog events.
Built from User Feedback — and Built to Scale
This update reflects real-world input from hospitals using Breezy at scale, while also laying the foundation for more advanced analytics and program-level insights in future releases. As Breezy Cloud continues to evolve, our focus remains on delivering clear, defensible data that supports operational decisions and compliance workflows.
See It Live
The new dashboard is available now.
You can explore it directly on our live demo site:
👉 https://demo-cloud.breezymed.com/
If you have feedback or ideas for future analytics, we’d love to hear from you — your input continues to shape the Breezy Cloud roadmap at Breezy Med.


-1.png?width=352&name=Breezy%20Smart%20Controller%20App%20Update%201.1.0%20(1)-1.png)